
 Íslenska

Having good monitoring infrastructure is important to ensure the reliability and performance of production systems. This post is about my experiments with gettings logs, metrics, and traces from a SlimPHP application to Grafana Cloud using an OpenTelemetry collector.
Introduction
As my applications are getting more complex, I want to get into a more capable observability stack. I often log into my servers and scroll through log files using vim, and I rely on simple uptime checks using UptimeRobot. I decided to try out Grafana Cloud as it's a free and popular platform, and I can always self-host it later if I want.
What I want in observability is having logs from all my services in one place, easy to search and look for anomalies. I also need metrics such as CPU, memory, disk, and network usage. As my apps stop being fully monolithic (e.g. adding background queue workers, and new decoupled services) it's nice to have context propagation in logs and traces to see the full lifecycle of incoming requests.
In addition, traces are really useful to see the duration of individual database queries and API calls within a request. And finally, I want to build dashboards where I can quickly see how my app is doing, e.g. daily active users, bandwidth used, latencies, both average and p99, and so on.
In this experiment we build a hello world Slim PHP app, with an API call using Guzzle, a single PDO query, and logging with Monolog. We use OTel autoloading which comes with the opentelemetry.so PHP extension, which means we don't need to add any OTel code to our PHP. We also run an OpenTelemetry collector with Docker and connect it to Grafana Cloud.
Setting up PHP
So first, we need to set up the opentelemetry.so extension for PHP, which can be done with pecl. I am on Debian and using the Remi APT repository for PHP to get the latest versions, we'll need php-pear and php-dev to install the extension from PECL.
$ sudo apt install php8.2-dev php8.2-pear
$ sudo pecl install opentelemetry
The extension now needs to be enabled in php.ini by adding this
[opentelemetry]
extension=opentelemetry.so
But if we are just using it for an experiment, we can skip that and just enable it when we run the PHP development server.
$ php -dextension=opentelemetry.so -S 0.0.0.0:9000Note: Composer complains if we don't have the opentelemetry extension enabled, so I think enabling it in php.ini is better, just remember to disable it when you're done.
The OpenTelemetry collector
The OpenTelemetry collector is a deamon that runs close to your application and listens for OTLP data on port 4317 (grpc) and 4318 (json). The data is then exported to a configured destination, e.g. Grafana Cloud, and it handles things such as batching and retries. It can also do processing such as filtering out sensitive information (privacy reasons) or non-important data (cost reasons).
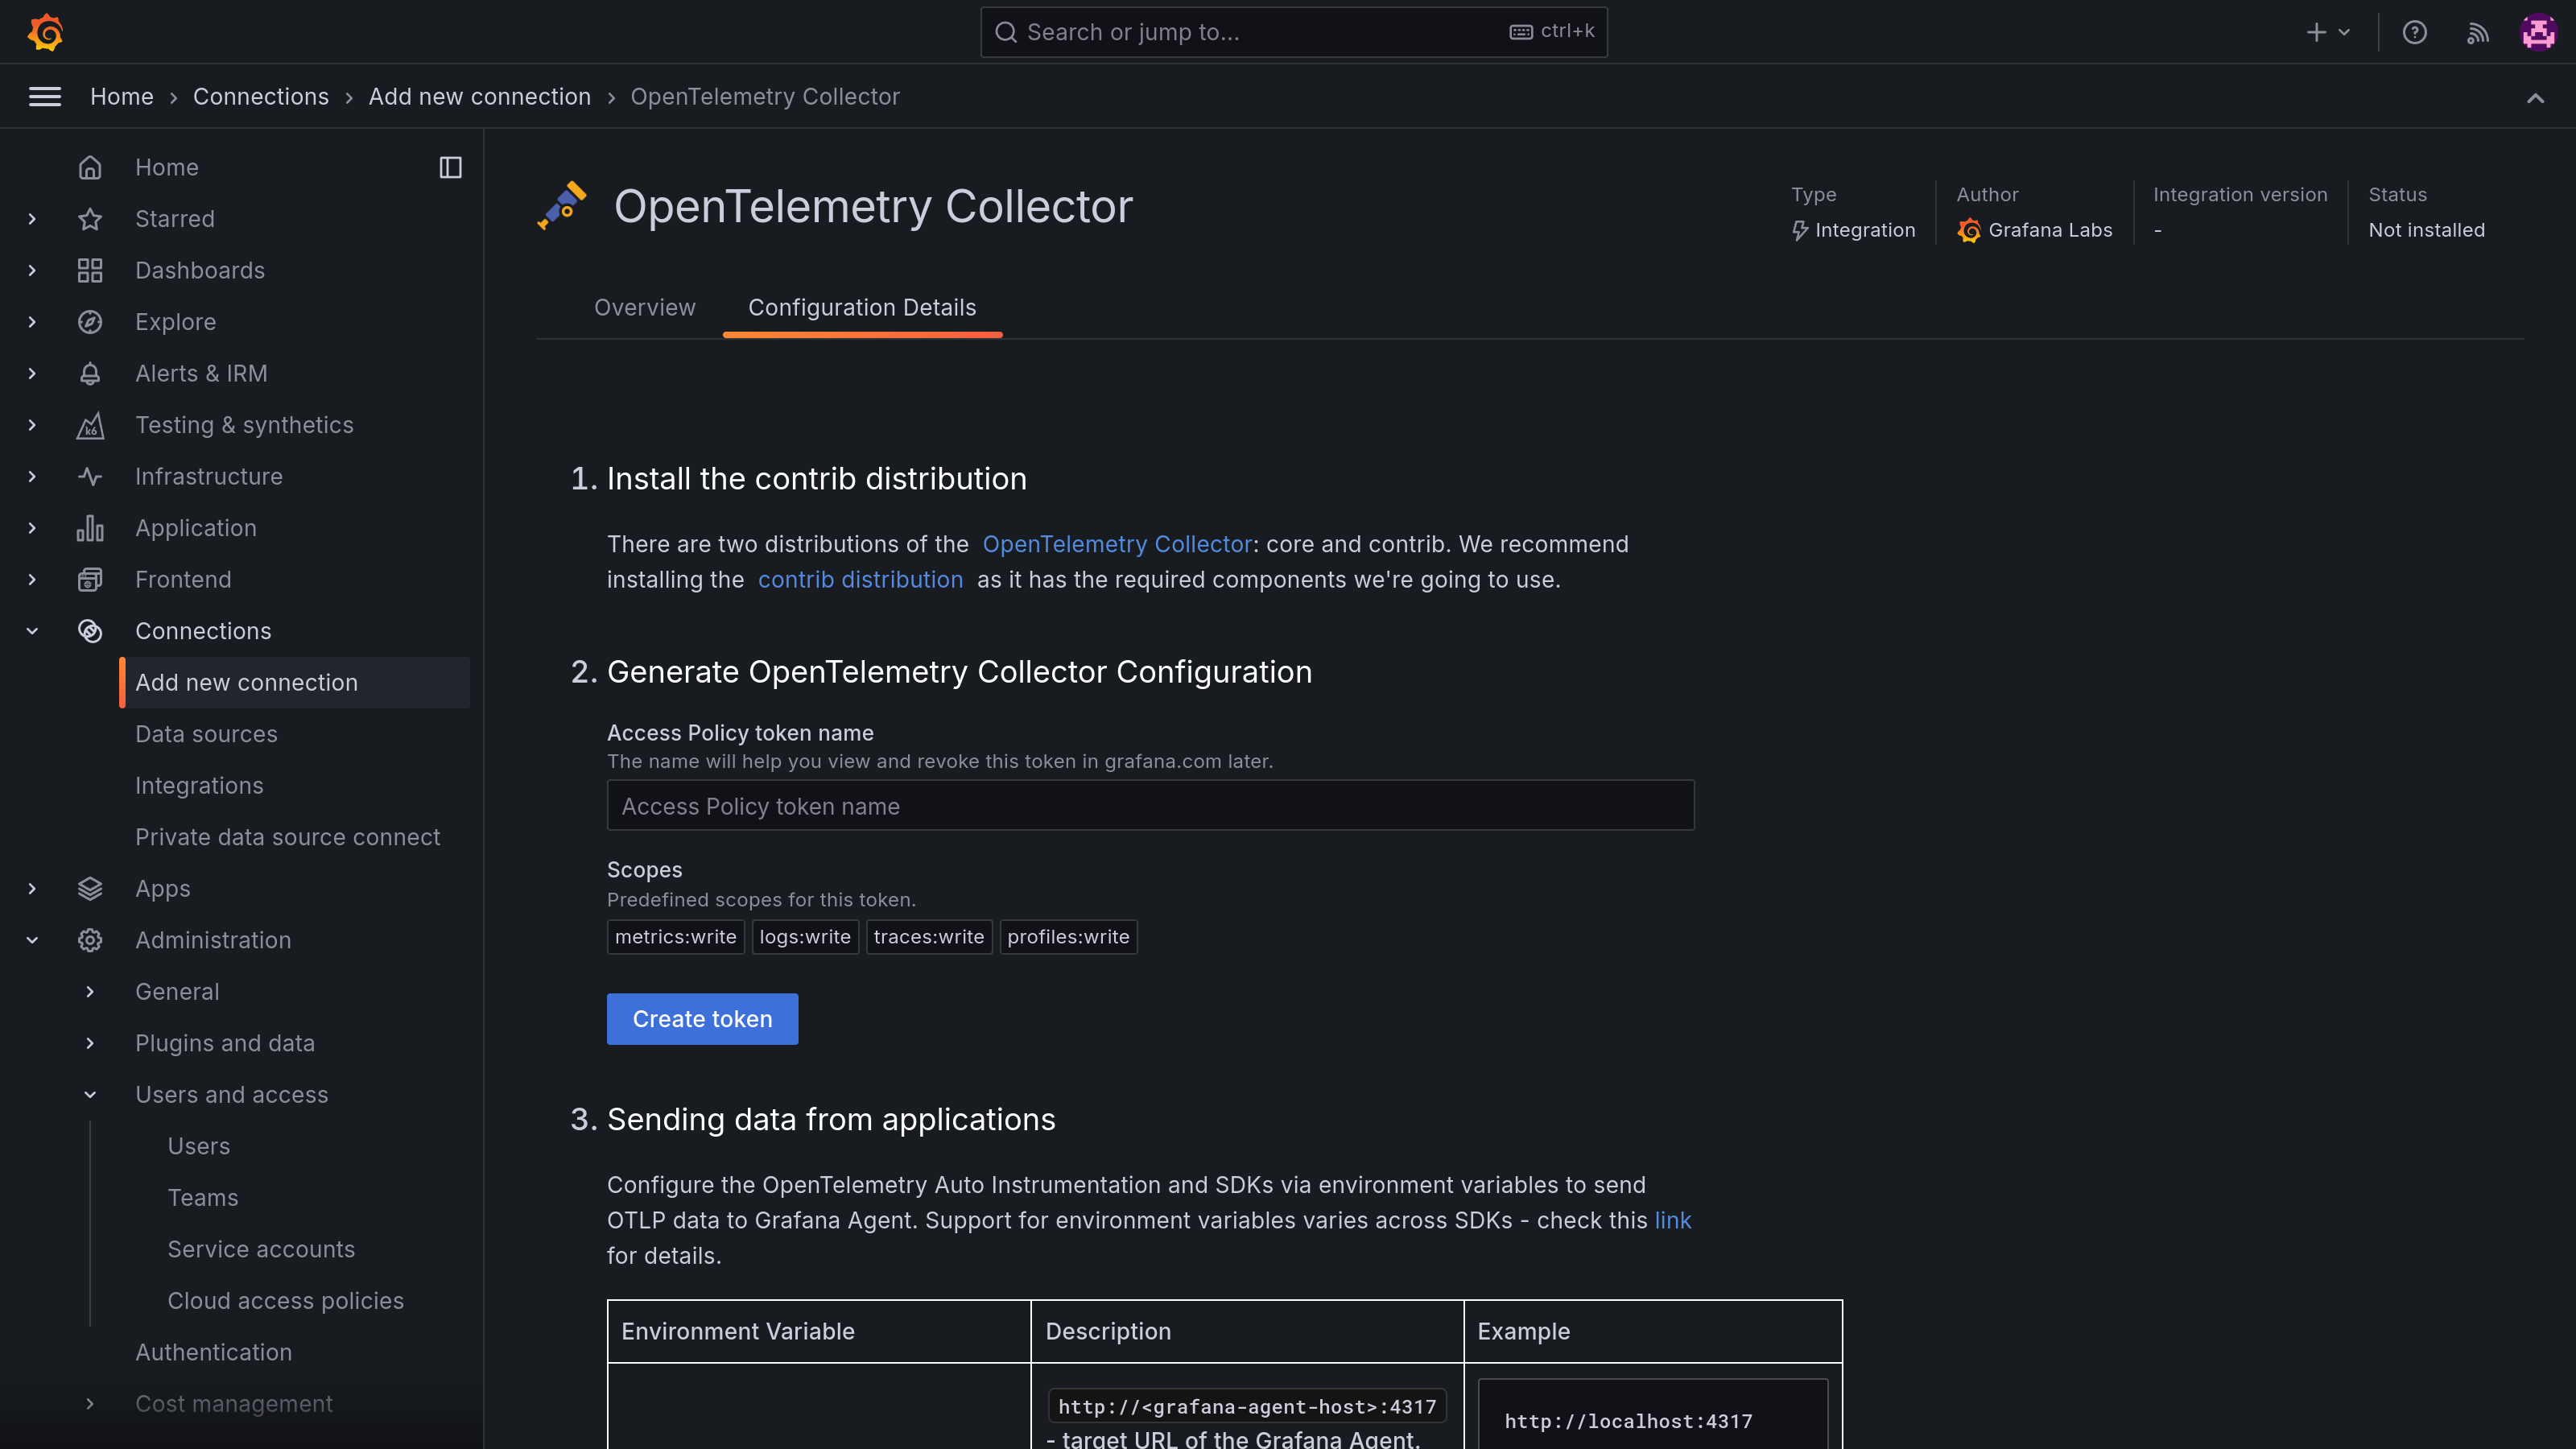
To quickly get started, we will start up the collector in a Docker container using docker-compose. But first, we need a configuration for the collector. Luckily, Grafana Cloud can create it for us. Under Connections > Add new connection, search for "Opentelemetry Collector", there you can click "Generate token" (see screenshot) which will generate configuration that includes auth tokens and destination URLs.
Create a new folder somewhere and save this configuration as config.yaml. We will also create a docker-compose.yaml in this directory with the content below.
services:
  otel-collector:
    image: otel/opentelemetry-collector-contrib
    volumes:
      - ./config.yaml:/etc/otelcol-contrib/config.yaml
    ports:
      - 1888:1888
      - 8888:8888
      - 8889:8889
      - 13133:13133
      - 4317:4317
      - 4318:4318
      - 55679:55679
Then you can run docker compose up and the collector will start.
Setting up a SlimPHP application
Okay, we have PHP with the OTel extension, and we have an OTel collector on our host. Now we just need an application. Let's set up a simple SlimPHP hello world project. Create a project directory and initialize with composer.
$ composer init
$ composer require slim/slim:"^4" slim/psr7:"^1"
$ composer require \
    open-telemetry/sdk \
    open-telemetry/exporter-otlp \
    open-telemetry/opentelemetry-auto-slim \
    open-telemetry/opentelemetry-auto-pdo \
    open-telemetry/opentelemetry-auto-guzzle
Note that we are installing the OpenTelemetry SDK, an OLTP exporter, and three auto instrumentation libraries for Slim, PDO, and Guzzle. This means that relevant spans will be created without adding any code on our side (I think this is cool).
Then create the application under src/app.php. It will have two routes, the index route makes an SQL query to a database that I have lying around, and the second route makes an API call with Guzzle.
1<?php
2
3require __DIR__ . '/../vendor/autoload.php';
4
5use Psr\Http\Message\ResponseInterface as Response;
6use Psr\Http\Message\ServerRequestInterface as Request;
7use Slim\Factory\AppFactory;
8
9$app = AppFactory::create();
10
11// This makes an SQL query
12$app->get('/', function (Request $request, Response $response, $args) {
13    $db = new PDO("pgsql:host=...", "postgres", "postgres");
14
15    $statement = $db->prepare('SELECT full_name FROM "user" WHERE id = :id');
16    $statement->execute(['id' => 1]);
17    $row = $statement->fetch();
18
19    $response->getBody()->write($row['full_name']);
20    return $response;
21});
22
23// This makes an API call
24$app->get('/ip', function (Request $request, Response $response, $args) {
25    $client = new \GuzzleHttp\Client(['base_uri' => 'https://api.ipify.org/']);
26    $response = $client->request('GET', '/');
27
28    $response->getBody()->write($response->getBody()->getContents());
29    return $response;
30});
31
32return $app;
This file returns our Slim instance. Finally, create the public entrypoint under public/index.php
1<?php
2
3$app = require __DIR__ . '/../src/app.php';
4
5$app->run();
We are now ready to run our application, we will use the built-in PHP development server. Remember that we need to enable the OpenTelemetry extension, and supply a few envionment variables to point to our local OTel collector.
$ OTEL_PHP_AUTOLOAD_ENABLED=true \
    OTEL_SERVICE_NAME=hamrar-backend-dev \
    OTEL_TRACES_EXPORTER=otlp \
    OTEL_EXPORTER_OTLP_PROTOCOL=http/json \
    OTEL_EXPORTER_OTLP_ENDPOINT=http://localhost:4318 \
    OTEL_PROPAGATORS=baggage,tracecontext \
    php -S 0.0.0.0:5000
We now open the application in our browser a few times. Telemetry should be flowing to the collector and then to Grafana Cloud.
Adding logging
While we're at it. Let's also try setting up logging. OpenTelemetry can also take care of this, we just need to register a special handler with Monolog. First let's install the libraries
$ composer require monolog/monolog
$ composer require open-telemetry/opentelemetry-logger-monolog
We then add some logging to our application.
1<?php
2
3// ... at the top of our app
4use Monolog\Logger;
5use OpenTelemetry\API\Globals;
6use OpenTelemetry\Contrib\Logs\Monolog\Handler;
7use Psr\Log\LogLevel;
8
9// ... inside one of our routes
10$loggerProvider = Globals::loggerProvider();
11$handler = new Handler($loggerProvider,LogLevel::INFO);
12$monolog = new Logger('otel-php-monolog', [$handler]);
13
14$monolog->info("Log message from index route");
Viewing the data in Grafana
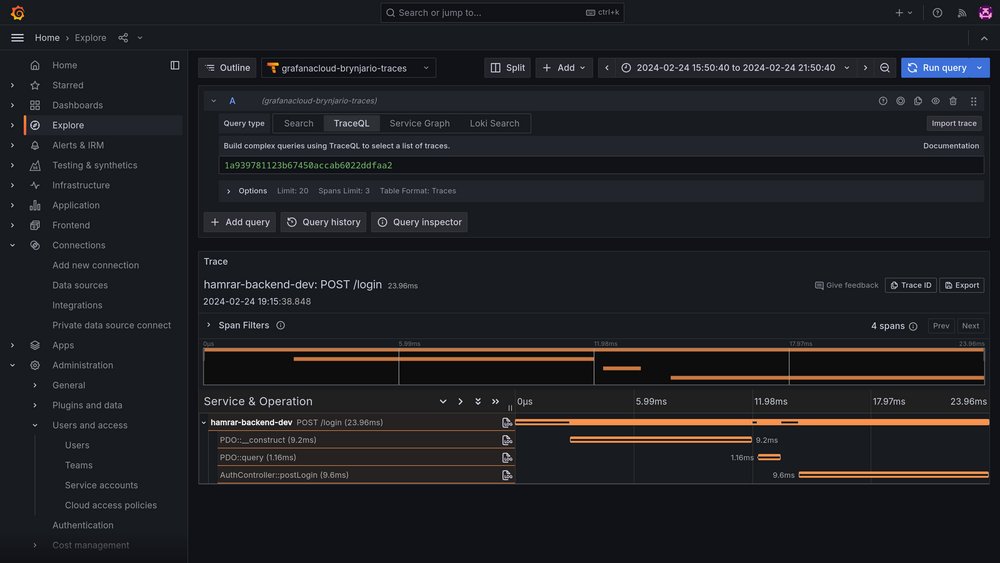
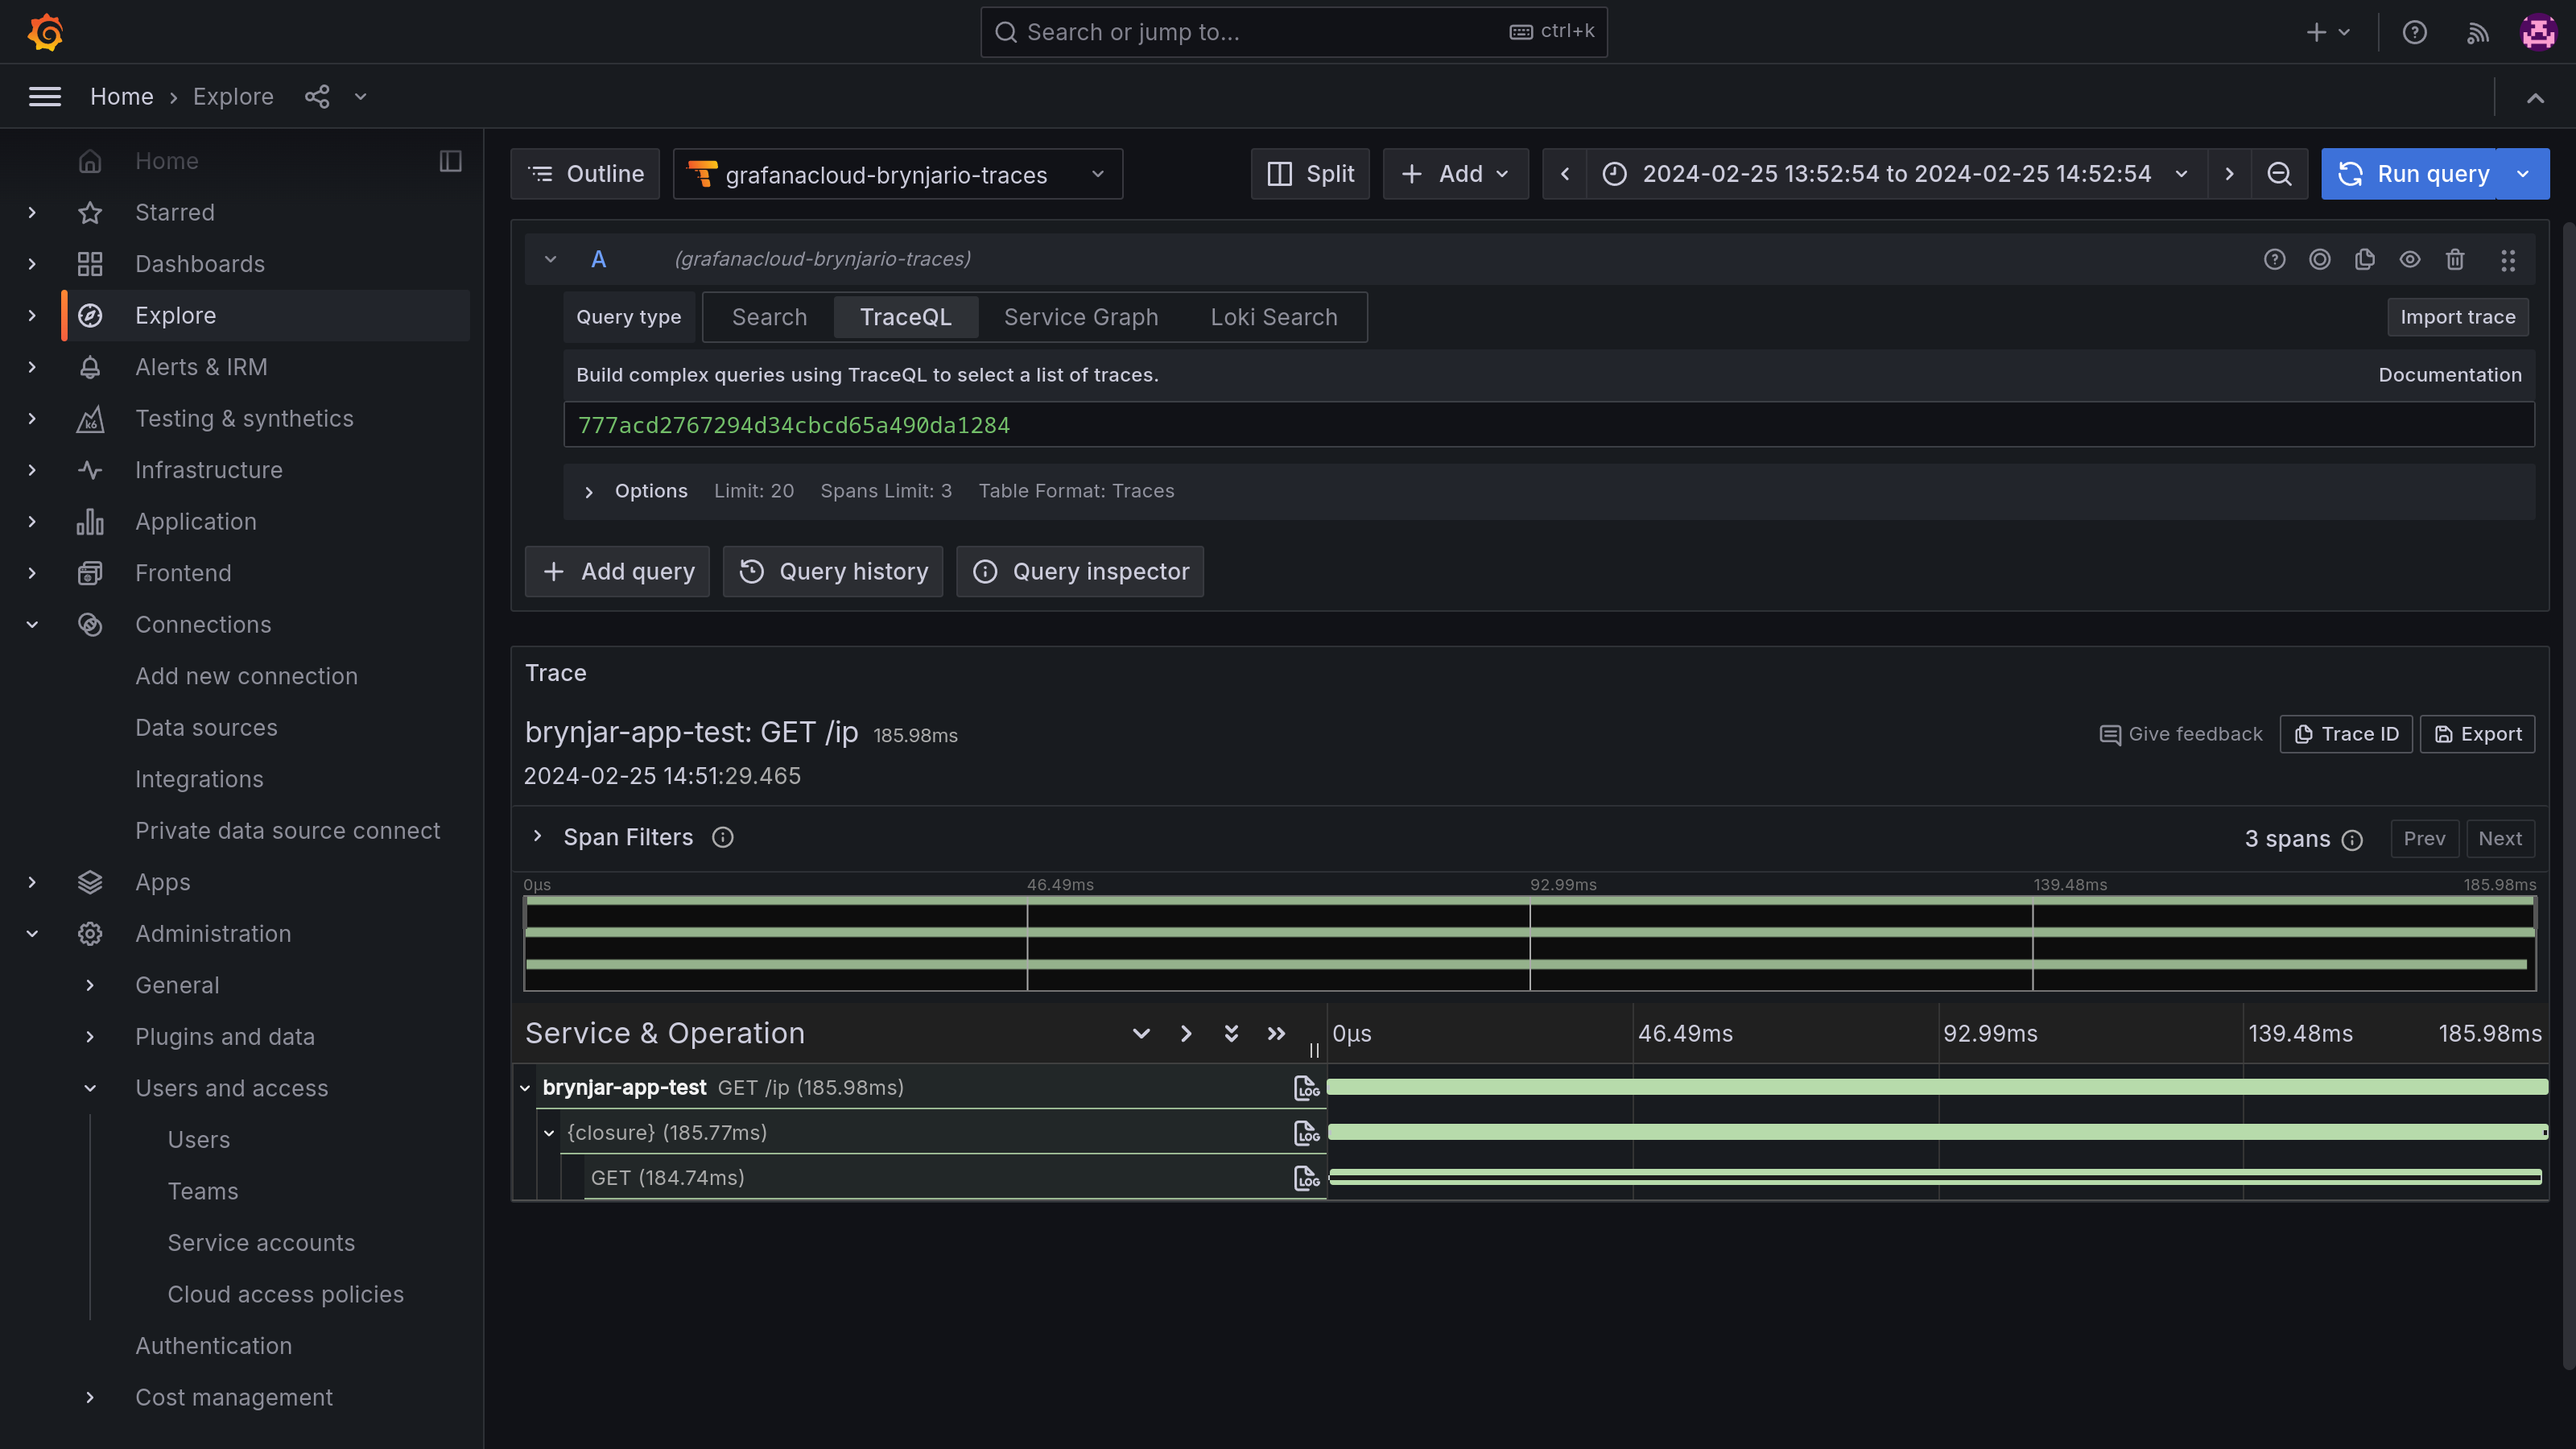
Traces and log lines should be flowing to Grafana Cloud, so let's take a look. Under the Explore section, we select the Tempo (traces) data source, then go to Search (not TraceQL) and hit Query. Then we should see our traces. The following screenshot shows a trace for the /ip route, and we can see our API call and how long it took. We can even see the URL of the call under the Tags section on the span.
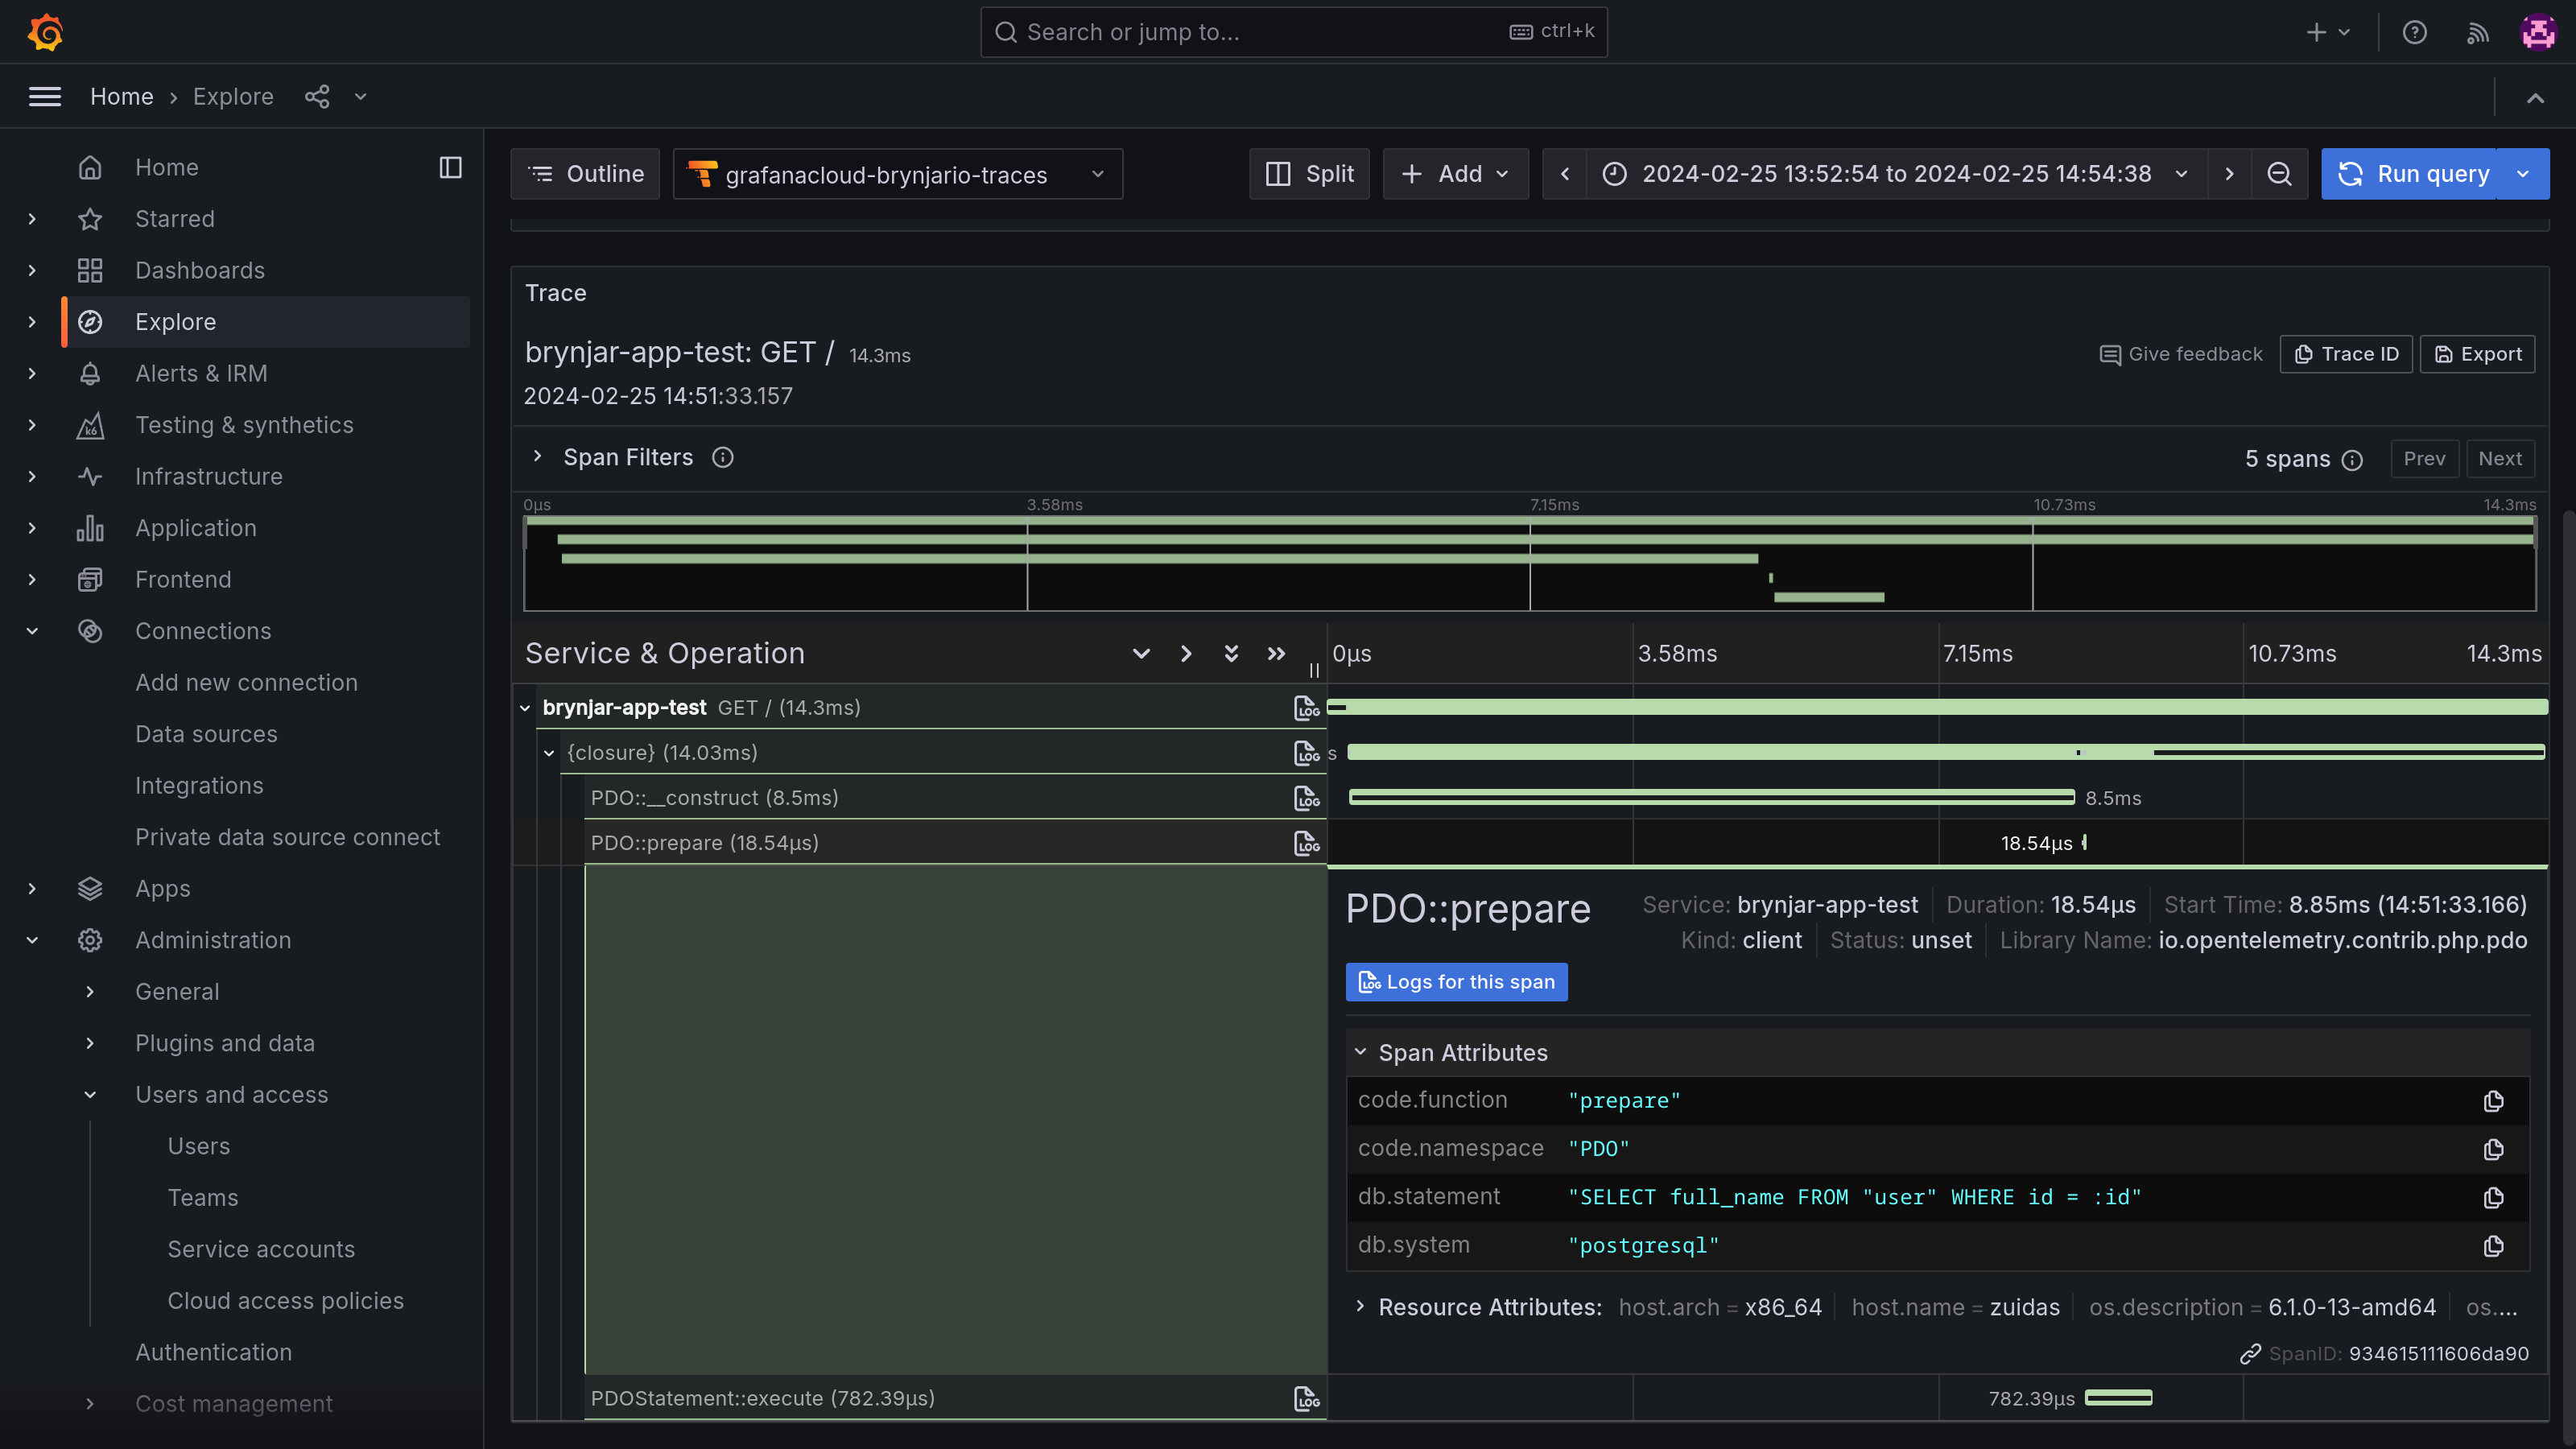
Next, we open a trace for the index route. There we can see a PDO query (construct, prepare, and execute spans), and if we open the Tags section on the prepare span, we can see the query that was executed. Neat insight into our application!
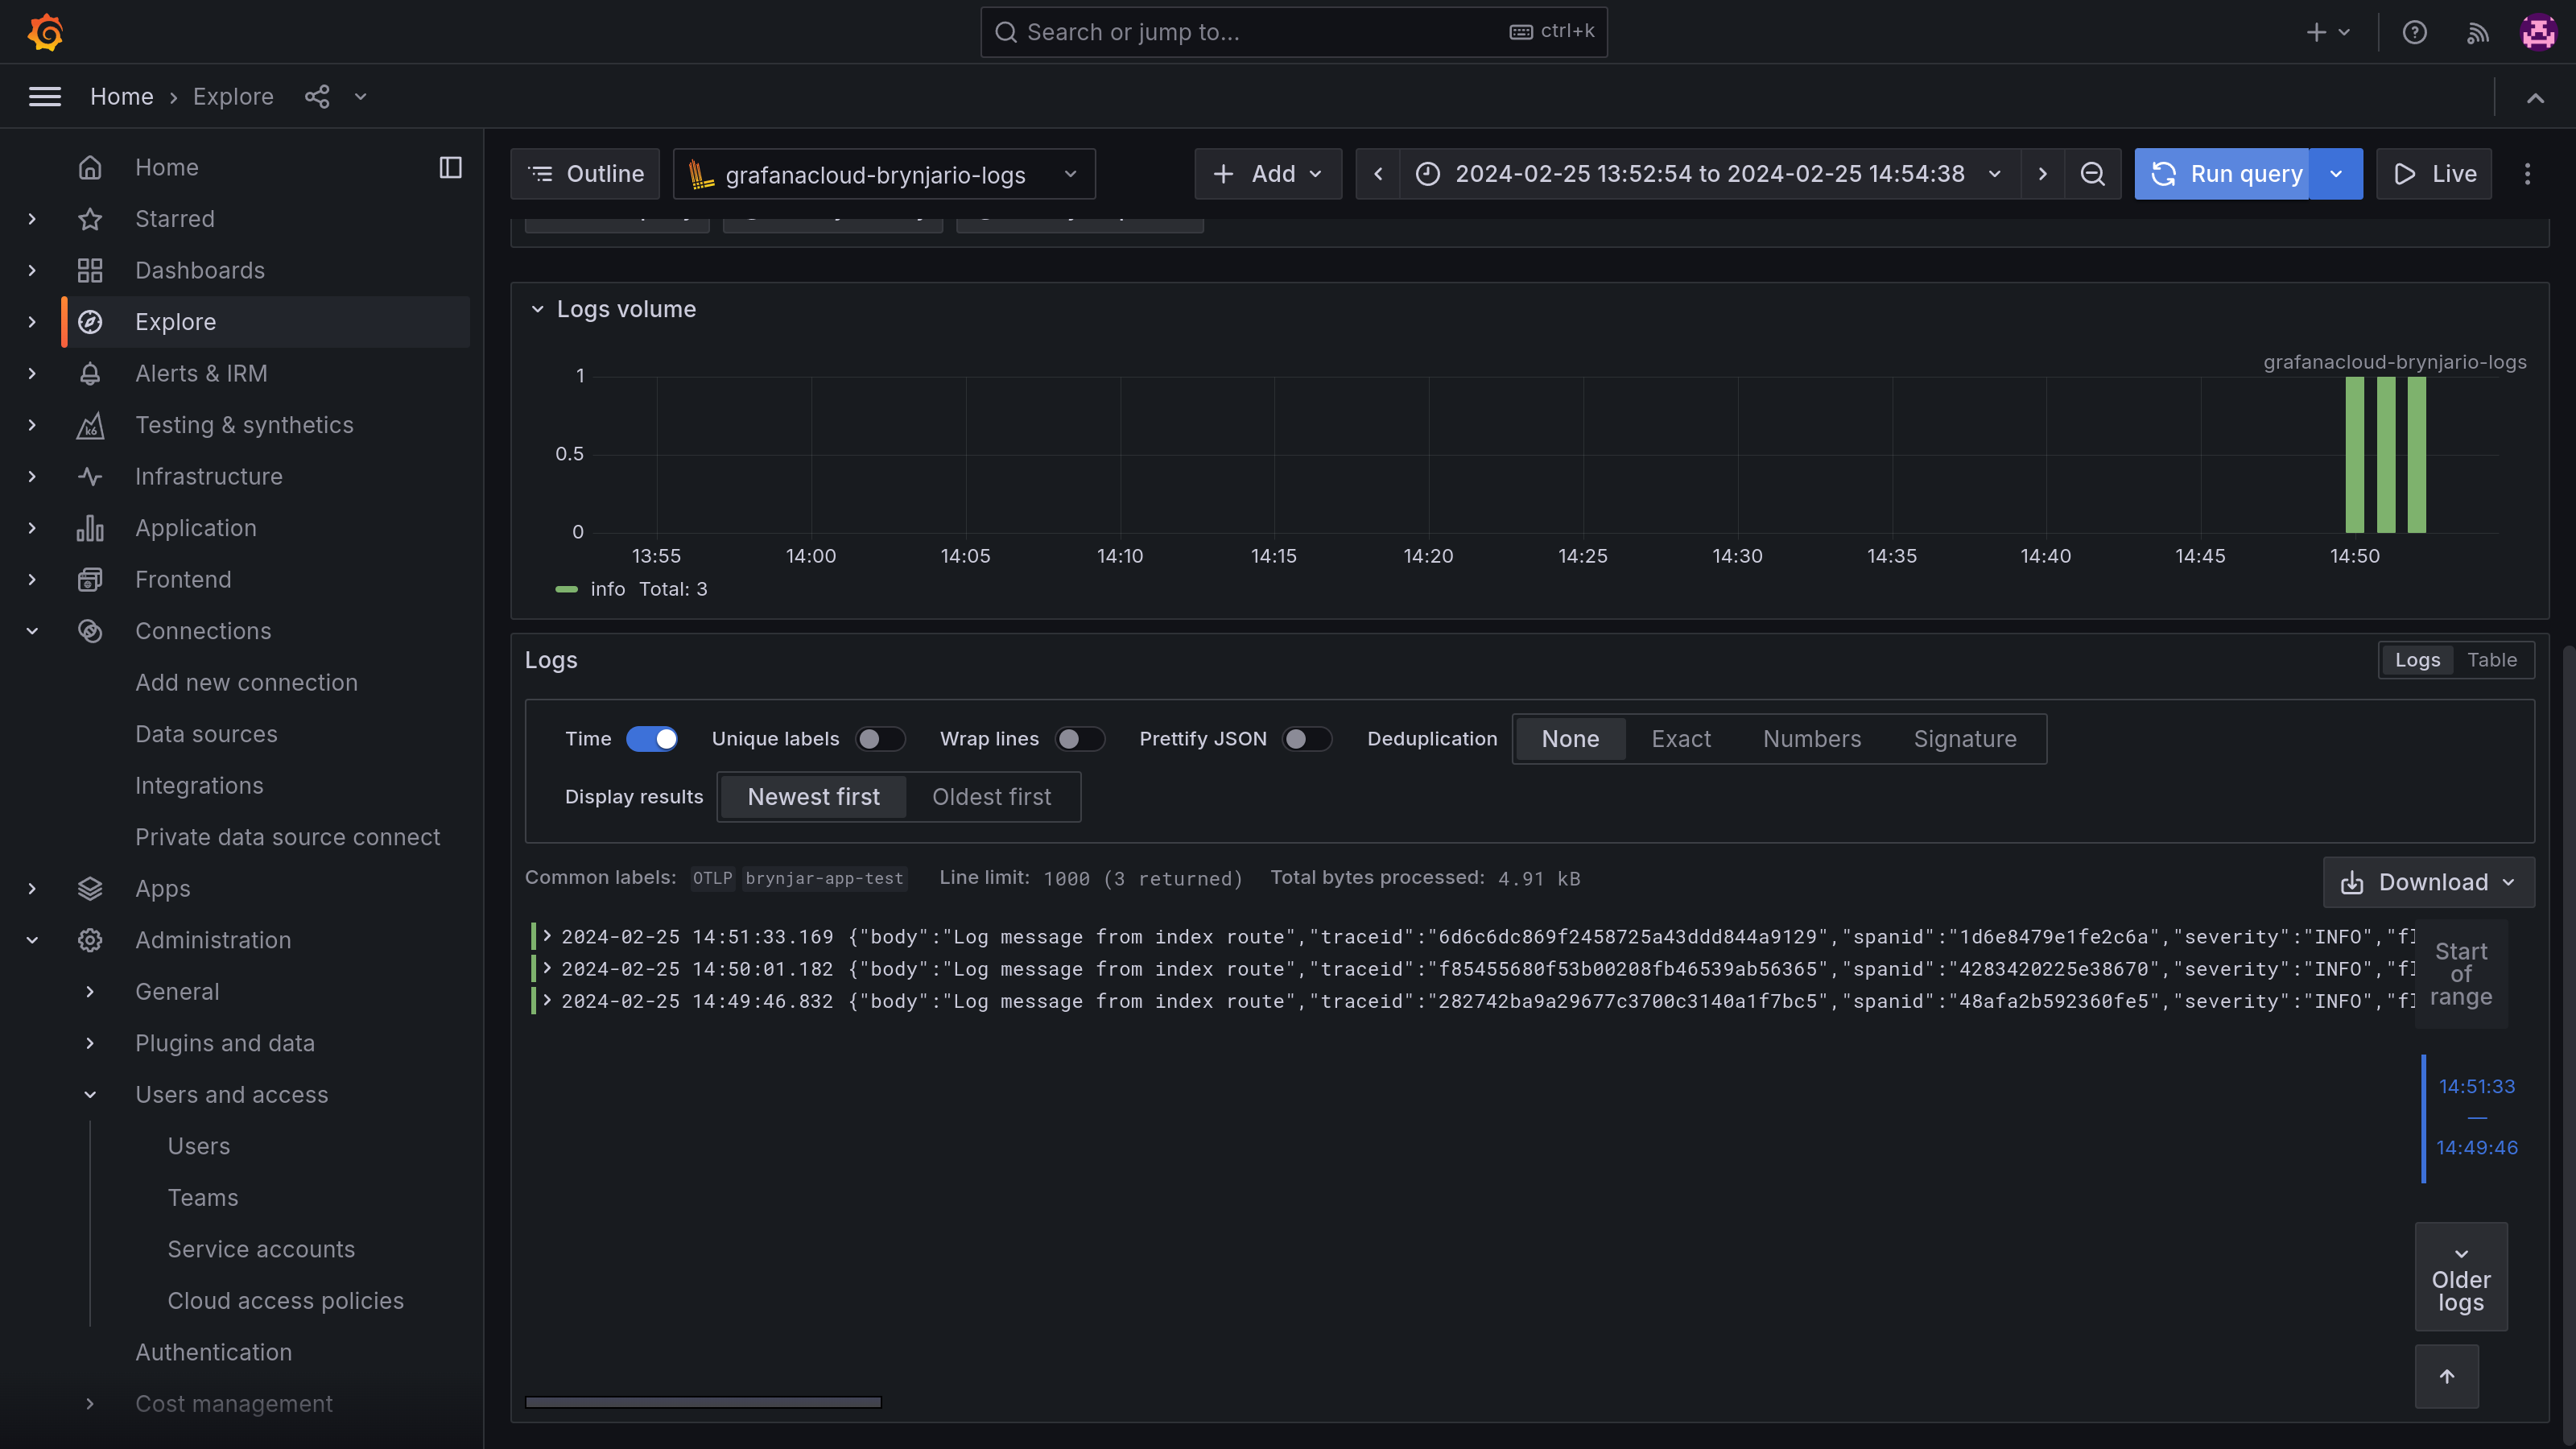
Finally, if we open the Loki (logs) data source, we can see the log statements from our application. You can see a trace and span ID in each line, meaning that we can jump between traces and log lines.
Remember, Grafana will show "No Data" if you don't specify a query. This confused me as I thought my collector was not working... would me more intuitive to show all the data at first and then allow you to filter down (what I'm used to from any other tool), but now I know.
Next steps
This is a good start, we know how to get data from our app into Grafana. Now I just need to learn more about Grafana, it's a pretty big tool that seems to have some learning curve. I also did not look into metrics even though I was going to, and I need to set up some dashboards and ideally alerts. But this is enough for this weekend, see you later :)